
LoJack Releases 8th Annual Vehicle Theft Recovery Report
- March 15, 2017
- Will Modelevsky
LoJack is happy to announce the release of our 8th Annual Vehicle Theft Recovery Report, which details our recovery data for 2016. The data was revealed in an infographic earlier today.
The key highlights of the 8th installment of the report include:
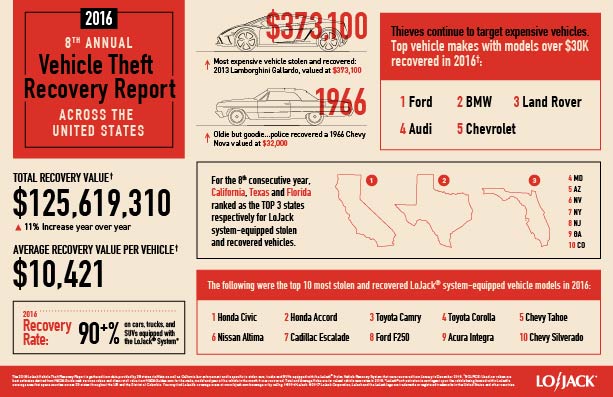
Increase in Recoveries Helps Slow the Cycle of Crime
Law enforcement officials recovered over $125 million worth of stolen vehicles equipped with the LoJack® Stolen Vehicle Recovery System, an 11% increase from the prior year.
Pat Clancy, Vice President of Law Enforcement, noted, “Last year, we saw an increase in the number stolen vehicle recoveries using LoJack technology, and it’s important to remember that stolen vehicles are used to finance or commit further crimes. LoJack gives law enforcement a very powerful tool to recover stolen vehicles and also take criminals off the street, interrupting this cycle of crime. That’s a benefit to the whole community.”
Thieves Targeting a Variety of Vehicles
Looking at the top 10 most stolen and recovered models list, there’s a solid mix of both foreign and domestic brands. The vehicles on this list represent a diverse cross-section of the auto industry itself, ranging from small sedans like the Honda Civic (#1 on the list) to full-size SUVs like the Cadillac Escalade (#7). This indicates that modern car thieves continue to have a broad range of interests and often target vehicles regardless of make or model.
The good news is that just as car thieves are becoming more advanced, so too are law enforcement officials. In partnership with LoJack, law enforcement agencies around the country are helping to minimize the financial impact of vehicle theft and provide peace of mind for vehicle owners. We are proud to say that last year, police helped recover more than 90% of vehicles equipped with the LoJack® System.
LoJack also recently released a Top Vehicle Theft Trends infographic. You can find read our full analysis and download the infographic here.
Looking for examples LoJack recovery stories? You can follow our Auto Theft Blog for exclusive LoJack content. Plus, you can follow us on Twitter and ‘Like’ us on Facebook to stay updated on all things auto theft.
Note: The 2016 LoJack Vehicle Theft Recovery Report is gathered from data provided by 28 states via Nlets as well as California law enforcement and is specific to stolen cars, trucks and SUVs equipped with the LoJack® Stolen Vehicle Recovery System that were recovered from January to December 2016. Used car values are best estimates derived from NADA Guide web services values and clean retail value from NADAGuides.com for the make, model and year of the vehicle in the month it was recovered. Total and Average Value are for valued vehicle recoveries in 2016.